
Online Courses Mastering Excel Analysis and Visualization

Microsoft Excel is a powerful tool used by professionals across various industries for data analysis and visualization. Its versatility makes it an essential skill for anyone looking to manage data effectively and derive actionable insights. Online courses in Excel data analysis and visualization cover a range of topics, from basic formulas and pivot tables to advanced dashboards and pivot charts. This guide will provide an overview of what these courses offer and how they can benefit you.
Why Do You Need These Skills?
Enhancing Career Prospects
Proficiency in Excel is a highly sought-after skill in the job market. Many roles in finance, marketing, human resources, and operations require the ability to analyze and visualize data using Excel. By learning these skills, you can enhance your resume and increase your employability.
Improving Decision-Making
Excel enables users to organize, analyze, and visualize data efficiently. This capability is crucial for making informed decisions based on data-driven insights. Whether you are tracking sales performance, budgeting, or conducting market research, Excel helps you interpret complex data sets.
Key Components of Excel Data Analysis
Excel Formulas
Excel formulas are fundamental for performing calculations and data manipulation. Courses often start with basic formulas like SUM, AVERAGE, and COUNT, and progress to more complex functions such as VLOOKUP, IF statements, and INDEX-MATCH. Mastering these formulas allows you to automate repetitive tasks and analyze data more effectively.
Pivot Tables
Pivot tables are a powerful feature in Excel that enable users to summarize large data sets quickly. They allow you to rearrange data dynamically, making it easier to identify trends and patterns. Pivot tables can be used to generate detailed reports without the need for complex formulas.
Data Cleaning
Before analyzing data, it is essential to ensure its accuracy and consistency. Data cleaning involves removing duplicates, handling missing values, and correcting errors. Courses on Excel data analysis teach various techniques for data cleaning to prepare your data for accurate analysis.
Visualizing Data with Excel
Pivot Charts
Pivot charts are an extension of pivot tables and provide a visual representation of the data. They allow you to create interactive charts that update automatically as you manipulate the pivot table. Pivot charts make it easier to present data visually and communicate insights effectively.
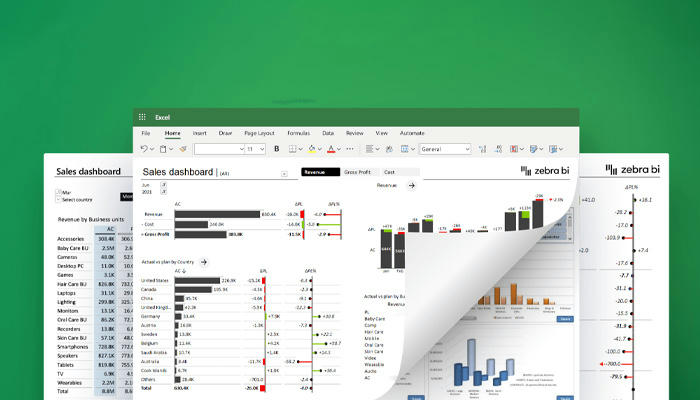
Excel Dashboards
Excel dashboards are comprehensive data visualization tools that combine multiple charts, graphs, and tables into a single interactive interface. Dashboards provide a high-level overview of key metrics and performance indicators, making them invaluable for business reporting and decision-making.
Popular Online Courses

Coursera's "Excel Skills for Business Specialization"
This specialization, offered by Macquarie University, covers essential Excel skills, including data analysis and visualization. It consists of several courses, starting from basic to advanced levels, and includes practical projects to reinforce learning.
Udemy's "Microsoft Excel - Data Analysis with Excel Pivot Tables"
This course focuses on using pivot tables for data analysis. It covers everything from creating basic pivot tables to advanced techniques for filtering and summarizing data. The course also includes sections on pivot charts and dashboards.
LinkedIn Learning's "Excel: Advanced Formulas and Functions"
This course is designed for those who want to deepen their understanding of Excel formulas. It covers advanced functions like array formulas, nested IF statements, and complex lookup functions. These skills are crucial for advanced data analysis.
How to Choose the Right Course

Assess Your Current Skill Level
Before selecting a course, assess your current knowledge of Excel. If you are a beginner, start with a course that covers basic concepts and gradually progresses to more advanced topics. For those with intermediate skills, look for courses that focus on specific areas like pivot tables or dashboards.
Check Course Content and Reviews
Review the course syllabus to ensure it covers the topics you are interested in. Read reviews from other learners to gauge the quality of the course and the effectiveness of the instructor. This will help you choose a course that meets your learning objectives.
Consider Course Duration and Format
Online courses vary in length and format. Some may be self-paced, allowing you to learn at your own speed, while others have a fixed schedule. Consider your availability and learning preferences when selecting a course. Ensure the course duration fits into your schedule and that you can commit the necessary time.
Tips for Successful Learning
Practice Regularly
Excel is a practical skill that improves with regular practice. Apply what you learn in the courses to real-world scenarios or personal projects. This hands-on approach reinforces learning and helps you retain new information.
Join Online Communities
Joining online forums and communities dedicated to Excel can be beneficial. These platforms allow you to ask questions, share insights, and learn from others' experiences. Engaging with a community can provide additional support and motivation.
Utilize Course Resources
Many online courses offer supplementary resources such as downloadable templates, quizzes, and project assignments. Take advantage of these resources to enhance your learning experience. They provide practical examples and additional practice opportunities.
Conclusion
Excel data analysis and visualization skills are invaluable in today's data-driven world. Online courses provide a convenient and flexible way to acquire these skills, whether you are a beginner or looking to advance your existing knowledge. By choosing the right course and committing to regular practice, you can master Excel and unlock new opportunities for career growth and effective decision-making. Whether you are using Excel for professional or personal purposes, the ability to analyze and visualize data will prove to be a valuable asset.